


- Strategic asset allocation inputs, fund manager expectations, and benchmark weights remain anchored to inflation of 2% to 3%, even as back-to-back supply shocks keep headline inflation above that range.
- Measured as a factor exposure, a typical pension portfolio is short inflation, and a conventional hedge allocation offsets only a small part of that exposure.
- Protection needs to match the stage of the shock, combining commodity-exporter currencies, shorter-dated inflation-linked bonds, and credible non-dollar currencies, local rates, and gold.
For most of the past three decades, investors operated in a world of abundant supply. Globalization integrated vast pools of labor into the world economy, cheap energy and tightly linked supply chains held down costs, and independent central banks anchored expectations. In that world, G7 inflation averaged about 2%, shocks were easily absorbed, and nominal bonds could be relied on to offset equity losses.
That world is giving way to one shaped by higher-for-longer inflation, driven by what I term a “rolling ball” of geopolitical and inflationary shocks. G7 inflation has averaged 4.5% so far this decade, with early signs that it is picking up again. Global portfolios are, however, still largely built for the old macroeconomic regime. Their planning assumptions, benchmark weights, and reliance on bonds as an equity hedge all presume that inflation will return to a range of 2% to 3%. Measured as a factor exposure, a typical total portfolio is short inflation, and a conventionally sized hedge allocation does little to offset that exposure.
This post builds on my earlier Enterprising Investor blogs on the reemergence of international investing, the limits of passive emerging market exposure, and structural reform as a source of returns. Here, I examine the evidence that portfolios remain positioned for the old range, how back-to-back supply shocks feed through to fiscal policy, bond markets, and currencies, and what protection holds up as the type of shock changes.

The Quiet Assumption Behind Today's Portfolios
I assess the assumptions embedded in today's portfolios through four lenses: analyst inputs and expectations; investor surveys; bond market signals; and current portfolio positioning.
Strategic asset allocation inputs remain anchored to the old range. J.P. Morgan's 2026 Long-Term Capital Market Assumptions assumes US inflation of 2.5% a year over the next 10 to 15 years, not far from the average of the 2010s. Analyst research reaches a similar conclusion, finding that conventional asset allocation needs CPI below 2.4% to work, a demanding threshold when core CPI is running close to 2.5% and headline CPI close to 3.5%
On investor expectations, the latest BofA Global Fund Manager Survey points the same way, with respondents expecting little or no pickup in inflation over the coming year (Chart 1 below) Large allocators, including Bridgewater’s Atul Lele, have also noted recently that most portfolios are “not positioned for 5-6% inflation, let alone even 3-4%.”
Chart 1: Net Share of Investors That Expect Higher Global CPI

Source: Bank of America Fund Manager Survey
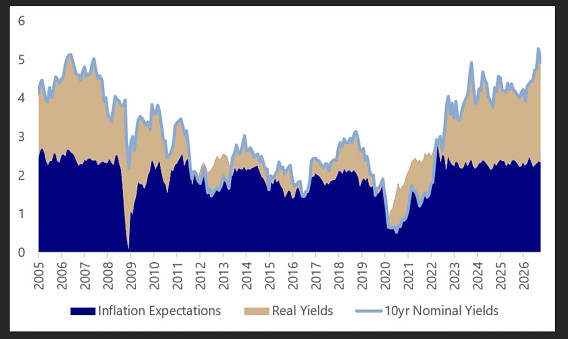
Bond investors have pushed yields sharply higher, but not because they expect more inflation. So far this year, the US 10-year Treasury yield has risen by almost 90 basis points while the 10-year breakeven inflation rate is broadly unchanged, despite a sharp rise in oil prices. The inflation-linked market is still pricing the old range, which keeps explicit protection inexpensive and suggests investors see the current rise in inflation as transitory. (Chart 2 below)
Chart 2: US 10-year government bond yield – split between inflation expectations and real yields
Source: Bloomberg, Author Calculations
The Total Portfolio Is Short Inflation
Measured as a factor exposure, the typical total portfolio is short inflation. When published estimates of each asset class's sensitivity to inflation surprises from Fang, Liu, and Roussanov are applied to the average allocation of the seven largest pension markets reported by the Thinking Ahead Institute, the portfolio loses roughly 4.7 percentage points of return for each percentage point of unexpected core inflation. A 5% allocation to TIPS would offset only about 5% of that exposure.
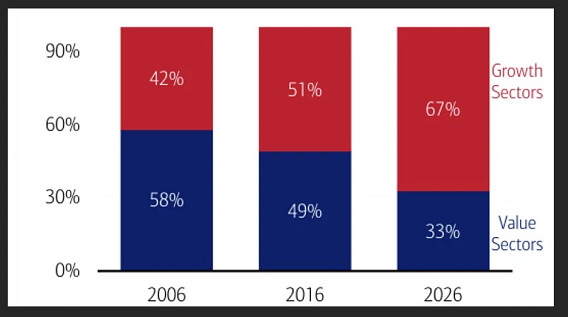
Changes in benchmark composition also help explain why this sensitivity has likely increased over time. Growth sectors now make up 67% of the S&P 500, up from 42% in 2006 (Chart 3 below). Equity benchmarks from the United States to emerging markets remain heavily concentrated in technology and AI-linked names.
Chart 3: Weight of Value vs Growth in S&P 500, Percent
Source: BofA Global Research, Bloomberg. “Growth sectors” = information technology, communication services, health care, and consumer discretionary, “Value sectors” = financials, industrials, consumer staples, utilities, real estate, energy, and materials.
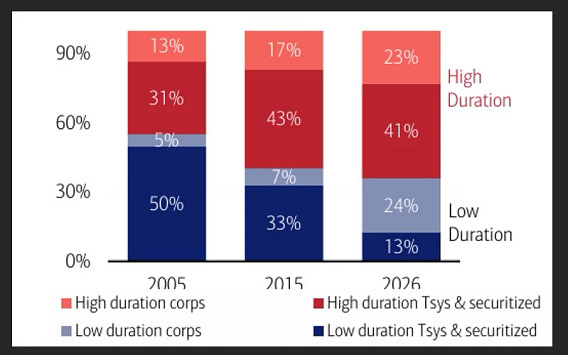
The same pattern is visible in fixed income, where around two-thirds of the US Aggregate bond index is now in securities with duration more than five years, against 44% two decades ago (Chart 4 below). AI-related debt issuance is also gaining momentum and is concentrated at the long end of the curve.
Chart 4: Weight of corporate bonds, Treasuries, and securitized products in US Aggregate Bond Index by duration
Source: BofA Research Investment Committee, Bloomberg. Short duration: Less than or equal to a duration of 5; Long duration = greater than duration of 5
As a result, both halves of the 60/40 portfolio carry more duration risk than they did 20 years ago, just as global bond yields are breaking out of their 25-year range.
The Rolling Ball
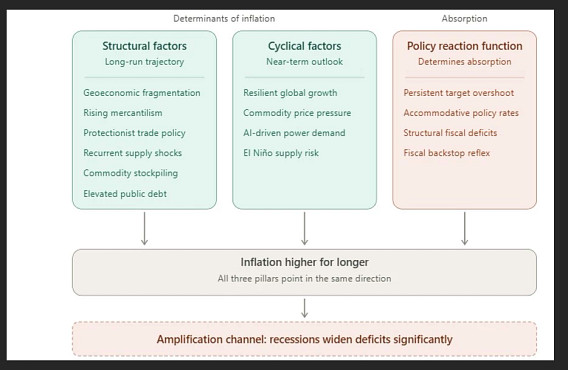
My framework for analyzing inflation has three parts: structural factors, which drive the long-term trajectory; cyclical factors, which shape the near-term outlook; and the policy reaction function, which determines how both are absorbed. At present, all three point to inflation running higher for longer.
Chart 5: Three-part framework to analyze Inflation
Source: Author Schematic
Structurally: The global economy faces a rolling ball of shocks, driven in part by geoeconomic fragmentation and increasingly mercantilist policies of restricted trade. Global supply chain pressure reached a record in December 2021, Russia's invasion of Ukraine tightened energy supply in 2022, US tariffs lifted the effective tariff rate to 17.9% in 2025, the highest since 1934, the 2026 Middle East conflict left US energy prices 16.3% higher year on year in August, and the world now faces what could be one of the strongest El Niño events in a generation.
Any one of these shocks may prove transitory, but the sequence has kept underlying inflation above target, because each new shock has arrived before the previous one had cleared. Compounding this is the stockpiling of critical commodities, which is adding further upward pressure on prices. Brown University’s Şebnem Kalemli-Özcan has noted that these supply shocks are the underlying reasons behind higher for longer inflation, which is compounded further by higher debt and other factors.
Cyclically: Global growth has remained resilient, adding to inflationary pressure. Rising commodity prices, higher power costs (driven in part by the AI investment push), and rising mortgage costs all point to cyclical upside risks to inflation.
Policy Reaction Function: Although the United States has missed its inflation target for more than 66 consecutive months, policy rates have remained largely accommodative. The larger constraint, however, is fiscal: US deficits remain above 6% of GDP at a time when governments are more inclined to cushion households and businesses at the first sign of trouble (the IMF finds that fiscal measures dominate the policy response to the 2026 energy shock). My research shows that deficits increase by 4% of GDP during recessions, which would put further pressure on issuance and the inflation trajectory.
Protection That Survives the Rotation
Because the nature of the shock keeps changing, protection should be spread across stages and sized against the whole portfolio's exposure rather than held as a fixed allocation:
- Commodity exporters, through both their equities and their currencies, carry positive exposure to energy inflation. Year to date, global energy ETFs are up 42%, and mining producers are up 19% - both outperforming global equities by a wide margin. Despite this, their weight in the global indices remains low, which presents a compelling opportunity.
- For monetary risk, protection must come from outside the currency under pressure, which matters more now that the United States accounts for nearly 70% of the MSCI ACWI, up from 44% in 2006. International markets therefore offer timely, and less expensive, diversification. This is particularly notable for undervalued quality stocks which experienced their worst underperformance last year and offer strong uncorrelated upside – especially as the AI trade has got more volatile.
- Shorter-dated inflation-linked bonds offset core inflation without the long real-rate duration that caused heavy losses on UK index-linked gilts after 2021, and with break evens less than 2.5% they remain inexpensive.
- Local-currency bonds issued by countries with credible, inflation-targeting central banks offer a strong opportunity, particularly where real yields are high. This is especially relevant for frontier and emerging markets that have recently undertaken reforms including by fixing their currencies (see: Structural Reforms are Creating New Global Investment Opportunities)
- Gold has re-emerged as a hedge against monetary and fiscal risk over the past few years. While near-term price movements are driven by investor expectations for the Fed’s hiking cycle, gold has recently found a structural investor base, and its sharp year-to-date underperformance presents an attractive entry point.
What Could Stop the Ball
There are three main risks to this thesis: high-yielding currencies can sell off alongside equities when a shock turns monetary, and crowded carry trades can unwind within days; a full reopening of the Strait of Hormuz, combined with the Federal Reserve tightening that futures markets already price, could bring an inflationary reprieve; and most importantly, AI-driven productivity gains could prove strongly disinflationary, although the investment phase comes first and adds to demand for power, metals, and capital.
None of these risks weaken the case for measuring inflation exposure across the whole portfolio. A global portfolio is meant to generate returns across cycles, and when risks and investor positioning are skewed squarely in one direction, it pays to tilt the portfolio the other way.
If you liked this post, don’t forget to subscribe to the Enterprising Investor.
All posts are the opinion of the author. As such, they should not be construed as investment advice, nor do the opinions expressed necessarily reflect the views of CFA Institute or the author’s employer.
Image credit: ©Getty Images