


- High valuations don't necessarily signal an imminent crash. The Shiller CAPE ratio has reached 40.3, but valuations have limited power for predicting stock market returns over the next one to five years.
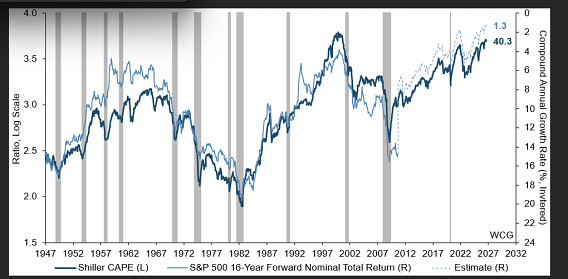
- Long-term returns tell a different story. The author's CAPE-based model estimates just 1.3% annualized nominal returns for the S&P 500 over the next 16 years.
- Portfolio diversification may become increasingly important. Elevated U.S. large-cap valuations strengthen the case for examining more attractively valued small-cap and international equities.
“You’re gonna learn about loss.” – Max Cady, Cape Fear (1991)
For those who haven’t seen the movie, that iconic line was delivered with chilling precision by Robert De Niro as the vengeful psychopath, Max Cady, in Martin Scorsese’s 1991 psychological thriller, Cape Fear.
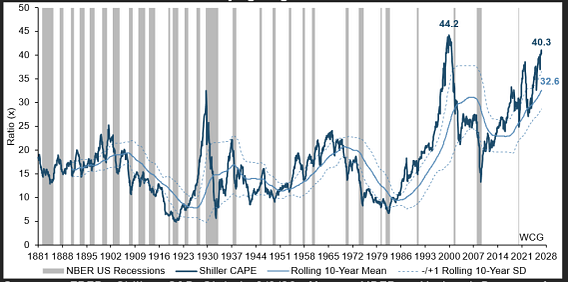
Robert Shiller’s Cyclically Adjusted Price-to-Earnings (CAPE) ratio recently achieved a dizzying 40.3x, soaring well above its 10-year moving average of 32.6x. When staring at that towering multiple, the highest since late-1999 (44.2x), it’s understandable for fearful investors to get spooked by Cady’s terrifying cinematic promise (see the chart below).
Shiller’s CAPE Has Achieved Terrifying Heights
Sources: FRED, Shiller, S&P Global, 9/9/26. Notes: NBER = National Bureau of Economic Research. SD = Standard deviation.

Valuations Are Meaningless for Near-Term Returns (i.e., One to Five Years)
Like most if not all valuation metrics, the CAPE is a terrible market-timing tool. Indeed, it’s practically meaningless for predicting near-term stock market performance:
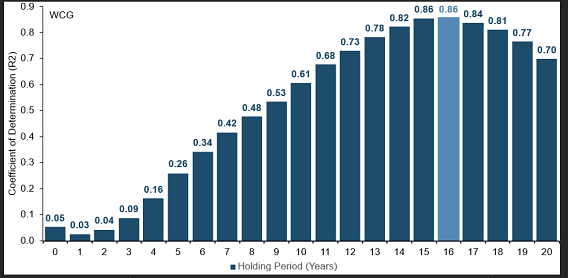
Take a Deep Breath: If your time horizon is anywhere from zero to five years hence, the R2 between the CAPE and S&P 500 forward returns is in a weak range of 0.03 to 0.26 (see the chart below).
Upside Risk: Said differently, high valuations alone don’t trigger immediate selloffs. Multiples can stay elevated for years, and selling stocks too early can risk missing out on significant late-cycle compounding as the reluctant buyers are forced into the market for fear of missing out (FOMO).
Valuations Establish Structural Guardrails for Long-Term Returns (i.e., 16 Years)
Sources: FRED, Shiller, S&P Global, 9/9/26. Notes: S&P 500 16-year nominal total returns (expressed as compound annual growth rates or CAGRs) were regressed against the natural logarithm of the CAPE (i.e., a linear-log regression). Interval of estimation = 1/1947 - 1/1999.
When Do Valuations Matter?
While today’s valuations don’t dictate today’s or even tomorrow’s price action, they can help define the structural guardrails for prospective generational wealth creation:
- When we lengthen our holding period to 16 years, the statistical relationship tightens significantly.
- Based on a 52-year estimation interval (1947-1999), the R2 between the logged CAPE and S&P 500 16-year forward nominal total returns rockets to a stellar 0.86 (see the chart above)!
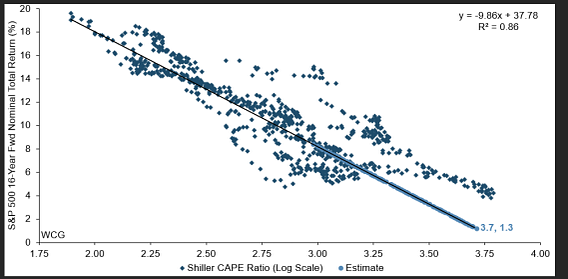
- Across diverse economic environments – including the low-inflationary 1950s, the stagflationary 1970s and the disinflationary 1980s/1990s – valuations explained an impressive 86% of the variation in 16-year forward returns on stocks (see the chart below)!
Overpaying for Stocks Likely Reduces Their Return in the Long Run (i.e., 16 Years)
Sources: FRED, Shiller, S&P Global, 9/9/26. Notes: Out of sample period = 1/1999 - 9/2026.
What Valuations Imply About Long-Term Returns
The CAPE has a strong inverse relationship with long-term returns on stocks. Intuitively, overpaying for equities reduces their gains over the long haul, just as underpaying for equities enhances their gains over the long haul. My 16-year linear-log regression model cuts through the short-term noise to provide a sober estimate of distant future outcomes:
- Equation: y = -9.86x + 37.78
- Input (x): The natural log of the current CAPE (40.3x) is roughly 3.7.
- Output (y): Plugging that value into the equation above produces an estimated 16-year forward nominal total return of just 1.3% annualized (see the chart below).
- Slope (m): -9.86 quantifies the severe, non-linear penalty that elevated starting valuations impose on long-term compounding. For each unit increase in ln(CAPE), expected annualized returns drop by 9.86 percentage points.
Intercept (b): 37.78 acts as the baseline anchor of the model, mapping how more than a half century of market data inexorably links higher entry multiples to lower long-term outcomes.
The CAPE Has a Strong Inverse Relationship with Long-Term Returns on Stocks
Sources: FRED, Shiller, S&P Global, 9/9/26. Notes: Out of sample period = 1/1999 - 9/2026. Direct investments can’t be made in indices. Past performance isn’t a guarantee of future performance.
Robbing Peter to Pay Paul
A 40.3x multiple doesn’t mean the sky’s falling this week. However, it does mean that future returns have essentially been pulled forward. While I doubt that a crash is imminent, bullish investors like us should be statistically prepared for expected nominal total returns on U.S. large-cap stocks to compress into the low single digits over the next decade and a half. By contrast, U.S. small-cap and international stocks are even more compelling based on their valuation merits alone.
If you liked this post, don’t forget to subscribe to the Enterprising Investor.
All posts are the opinion of the author. As such, they should not be construed as investment advice, nor do the opinions expressed necessarily reflect the views of CFA Institute or the author’s employer.
Image credit: ©Getty Images